MediumAxis Data Academy: Who Really Controls Global Business?
Posted by
MediumAxis |
March 18, 2026
Share this page
🎯 Who Really Controls Global Business?
Separating Fund Holdings from Operational Control in 21M Ownership Links / An Exclusive Data Research by MediumAxis
📊 21 million ownership relationships analyzed • 🌍 19 countries mapped • 🔍 21% match rate with verified revenue data • ⚠️ 9.8M entities flagged for review
💡 Key Finding
The entities appearing as “parents” most frequently in global ownership networks are not industrial conglomerates—they are financial intermediaries: asset managers, custodian banks, and index fund providers. This reflects investment holdings, not operational control. True operating companies with verified revenue tell a different story.
Who Actually Controls Global Business?
When we talk about “the world’s largest companies,” we usually think of names like Apple, Amazon, or major industrial conglomerates. These companies dominate headlines, market capitalization rankings, and public perception of economic power.
But ownership tells a very different story.
Behind every operating company sits a network of shareholders, holding entities, and controlling interests. At global scale, these ownership structures form a dense and highly interconnected system — one that is largely invisible in traditional business analysis.
This research takes a different approach.
Instead of looking at revenue or market value, it analyzes corporate control — tracing how companies are connected through direct and ultimate ownership relationships across millions of entities.
Dataset & Scope
The analysis is based on a large-scale corporate ownership dataset covering:
~20 million companies and subsidiaries
direct and ultimate parent relationships
cross-border ownership links across multiple jurisdictions
The data is derived from aggregated registry sources, including datasets such as Bureau van Dijk (BvD), and processed to reconstruct global ownership structures at scale.
Rather than focusing on a small sample of public firms, this approach captures the broader corporate graph, including private companies, holding structures, and investment vehicles.
Why This Matters
Ownership is the foundation of control.
Understanding who ultimately owns and connects companies reveals:
how economic power is distributed
which institutions sit at the center of global business
how capital flows across borders
and how corporate structures differ across regions
It also exposes a key blind spot:
The entities that control global business are often not the ones that operate it.
A Note on Interpretation
Large-scale ownership data comes with structural challenges:
some entities represent investment or custody structures, not traditional operating companies
corporate service providers and nominee entities can appear as intermediaries
regional differences (especially in jurisdictions like China) introduce variations in reporting and structure
Where relevant, these effects are considered in the interpretation of results. With that context, we can now examine what the data actually reveals.
🏢 The Two Layers of Corporate Power
Layer 1: Financial Intermediaries (Hold Shares, Not Operations)
Top 15 by subsidiary count. Revenue data often unavailable because fund holdings ≠ operational revenue.
Rank
Parent
Country
Subsidiaries
Category
1
Dimensional Holdings Inc
United States
12,693
Asset Manager
2
Vanguard Group Inc
United States
11,424
Asset Manager
3
BlackRock Inc
United States
10,640
Asset Manager
4
State Street Corporation
United States
6,227
Custodian Bank
5
Bank of New York Mellon
United States
6,124
Custodian Bank
6
Charles Schwab Corporation
United States
5,618
Asset Manager
7
Goldman Sachs Group Inc
United States
5,536
Global Bank
8
Geode Holdings Trust
United States
5,000
Asset Manager
9
JPMorgan Chase & Co
United States
5,407
Global Bank
10
Morgan Stanley
United States
5,068
Global Bank
11
Invesco Ltd
Unknown
4,895
Asset Manager
12
Northern Trust Corporation
United States
4,749
Custodian Bank
13
Wells Fargo & Company
United States
4,689
Global Bank
14
FMR LLC (Fidelity)
United States
4,479
Asset Manager
15
UBS Group AG
Switzerland
4,446
Global Bank
⚠️ Note: Revenue figures from Apollo.io represent organizational revenue, not assets under management. For fund managers like BlackRock, AUM ($10T+) far exceeds operational revenue.
Layer 2: Operating Conglomerates — Verified with Revenue
Top 15 operating companies with verified Apollo revenue data. Revenue bands for cleaner visualization.
Rank
Parent
Country
Subs
Revenue Band
Industry
1
Toyota Motor Corporation
Japan
641
$100B-$500B
Automotive
2
Total SA
France
1,269
$100B-$500B
Energy
3
Carrefour
France
556
$50B-$100B
Retail
4
ArcelorMittal SA
Luxembourg
691
$50B-$100B
Steel/Mining
5
WPP PLC
United Kingdom
537
$10B-$50B
Advertising
6
Aon PLC
United Kingdom
993
$10B-$50B
Insurance
7
Man Group PLC
Unknown
1,058
$1B-$10B
Asset Management
8
Sumitomo Mitsui Financial
Japan
1,156
$10B-$50B
Banking
9
Canaccord Genuity Group
Canada
641
$500M-$1B
Financial Services
10
New York Life Insurance
United States
1,385
$1B-$10B
Insurance
11
Eaton Vance Corp
United States
3,278
$1B-$10B
Asset Management
12
Massachusetts Mutual Life
United States
741
$1B-$10B
Insurance
13
Lord Abbett & Co
United States
599
$50M-$100M
Asset Management
14
Kennedy Capital Management
United States
537
$10M-$50M
Asset Management
15
Ashford Hospitality Trust
United States
521
$500M-$1B
Real Estate
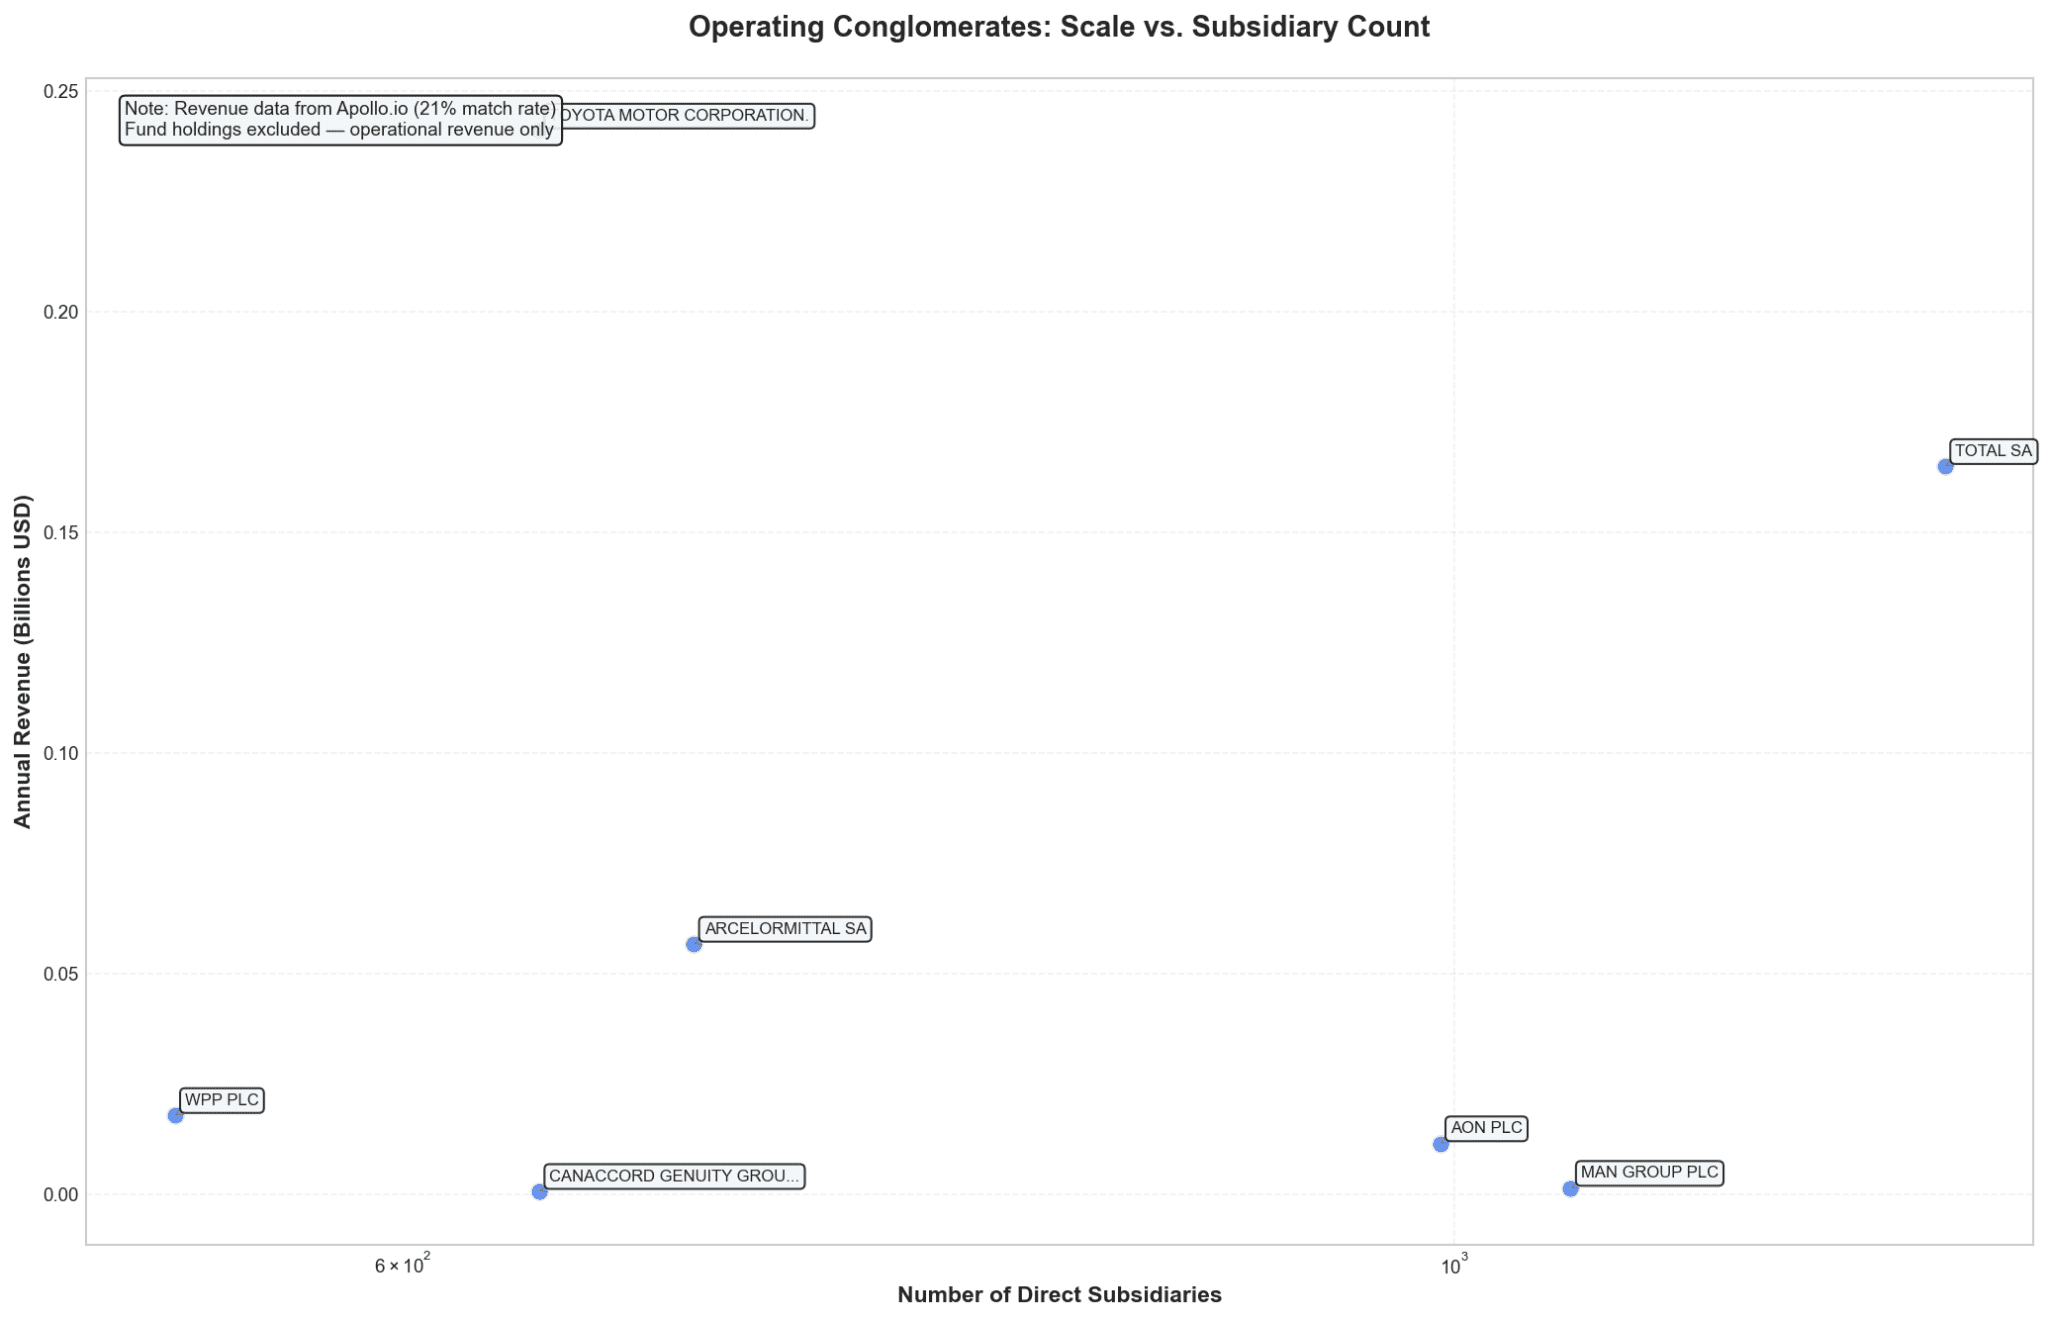
📊 Operating Scale: Subsidiaries vs. Revenue
Scatter plot of verified operating conglomerates. Note the wide range: some companies achieve massive revenue with relatively few subsidiaries.
🔍 Click image to enlarge • Data: Apollo.io revenue verification (21% match rate)
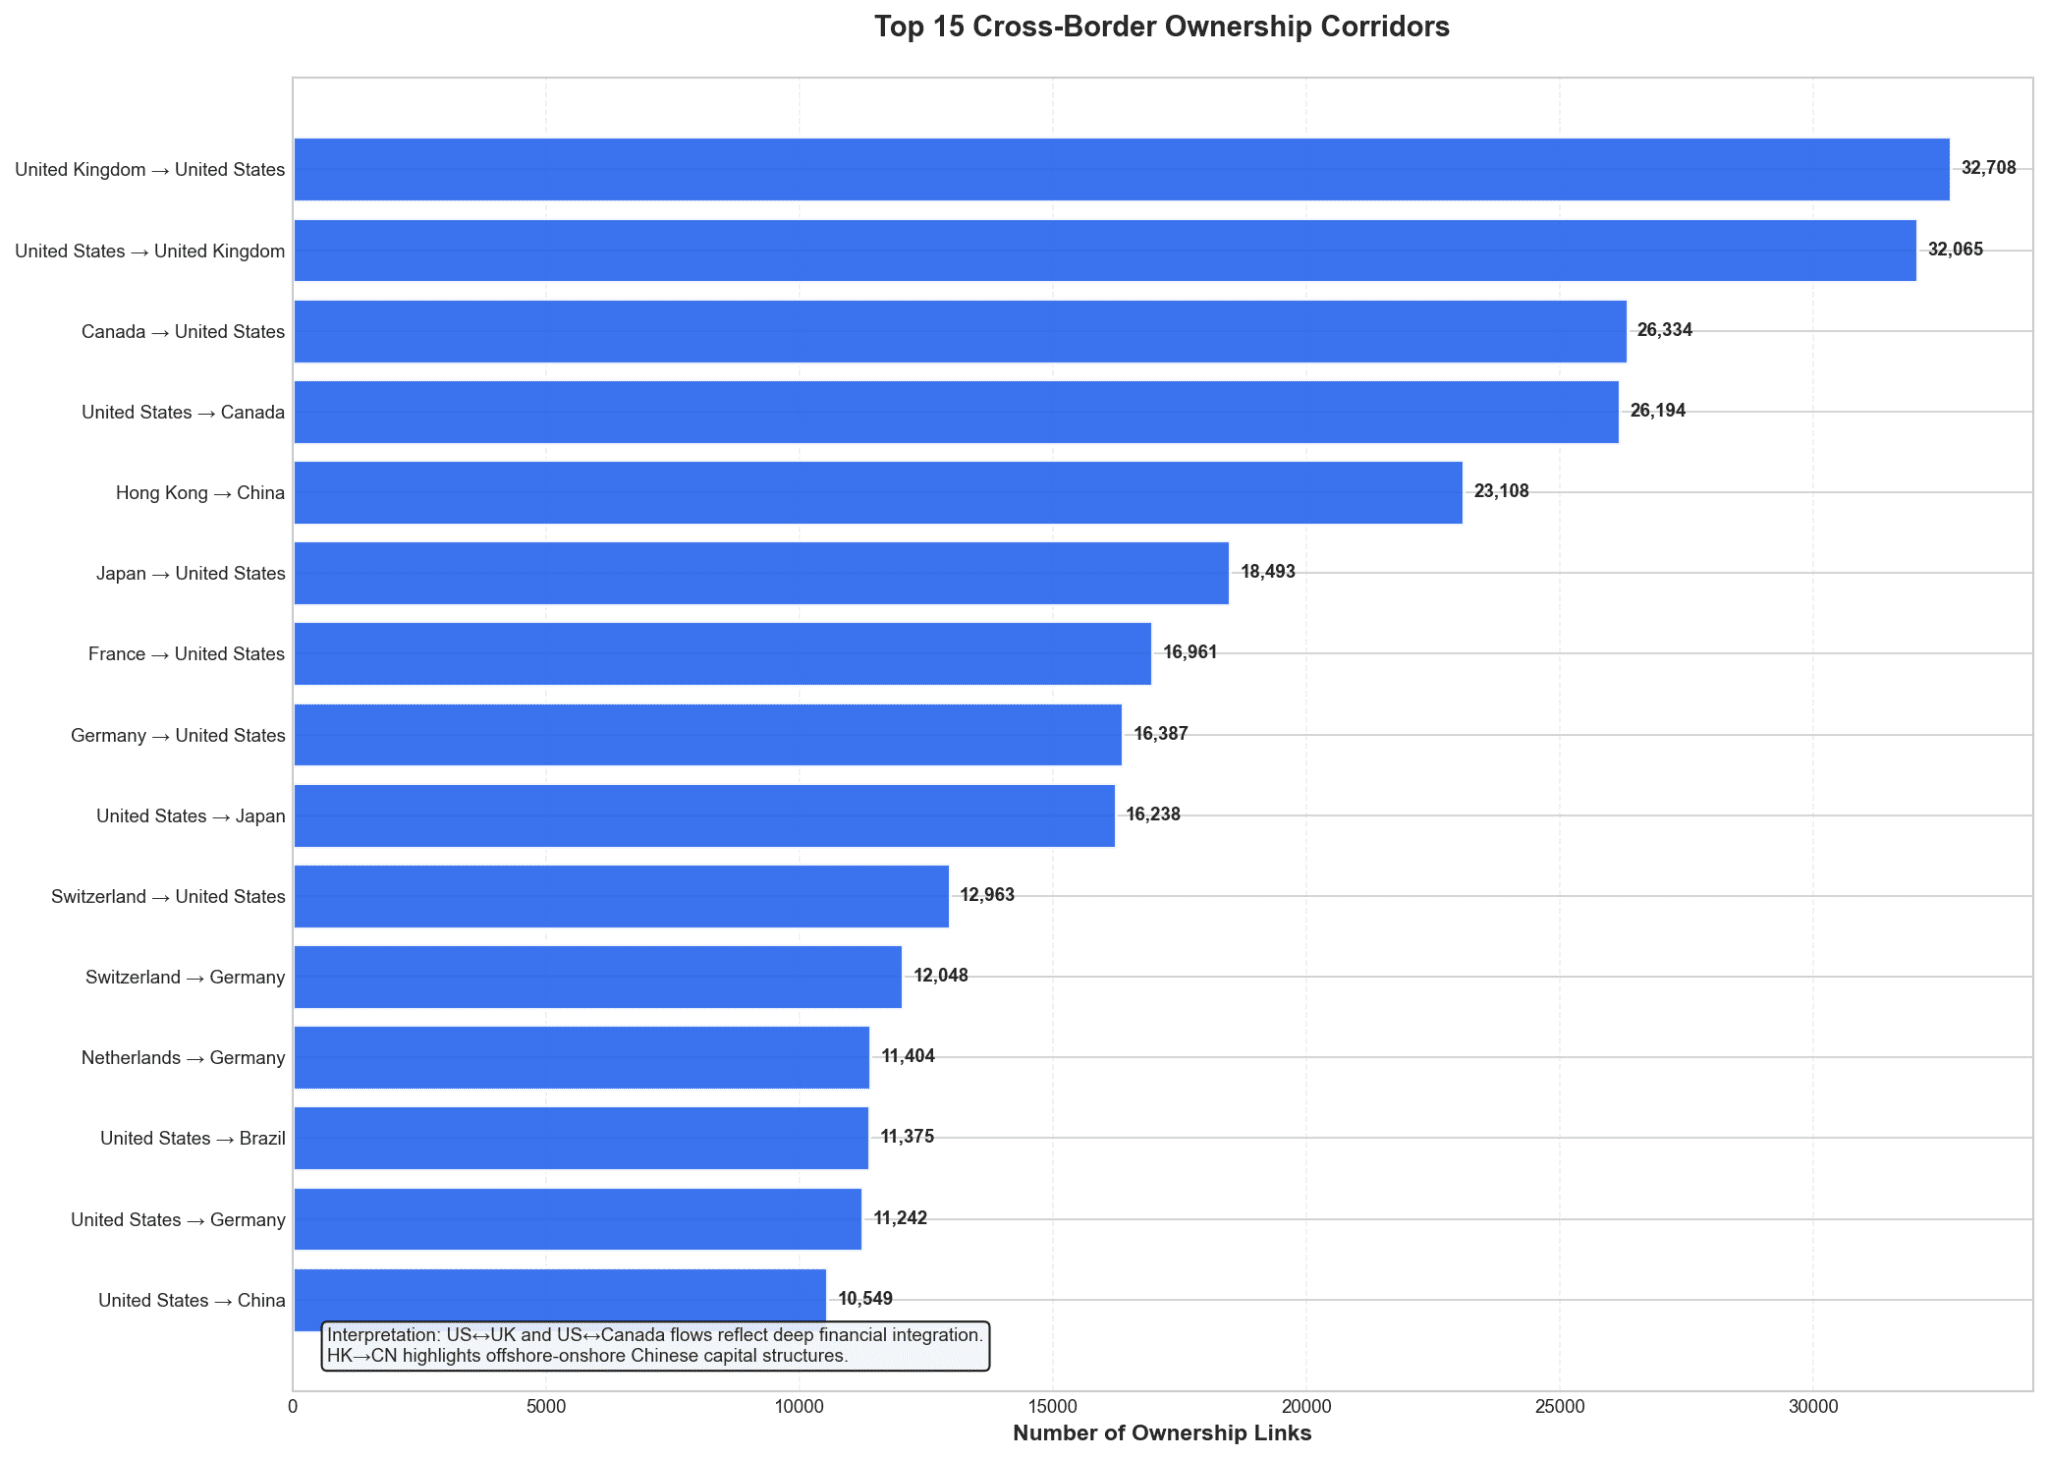
🌍 Cross-Border Ownership Corridors
Top 15 Ownership Flows by Volume
These 15 corridors represent ~48% of all cross-border ownership links, highlighting deep financial integration between major economies.
🔍 Click image to enlarge • Interpretation: US↔UK/CA flows reflect financial integration; HK→CN shows offshore-onshore Chinese structures
Detailed Flow Analysis
From
To
Links
Interpretation
United Kingdom
United States
32,708
Deep financial integration; fund domiciles
United States
United Kingdom
32,065
Reciprocal investment flows
Canada
United States
26,334
North American capital integration
United States
Canada
26,194
Reciprocal flows
Hong Kong
China
23,108
Offshore-onshore Chinese capital structures
Japan
United States
18,493
Japanese institutional investment in US markets
France
United States
16,961
European fund holdings in US equities
Germany
United States
16,387
German institutional investment
United States
Japan
16,238
US fund holdings in Japanese equities
Switzerland
United States
12,963
Swiss wealth management exposure to US markets
Switzerland
Germany
12,048
European wealth management corridor
Netherlands
Germany
11,404
EU cross-border investment flows
United States
Brazil
11,375
Emerging market capital inflows
United States
Germany
11,242
US institutional investment in EU
United States
China
10,549
US fund exposure to Chinese equities
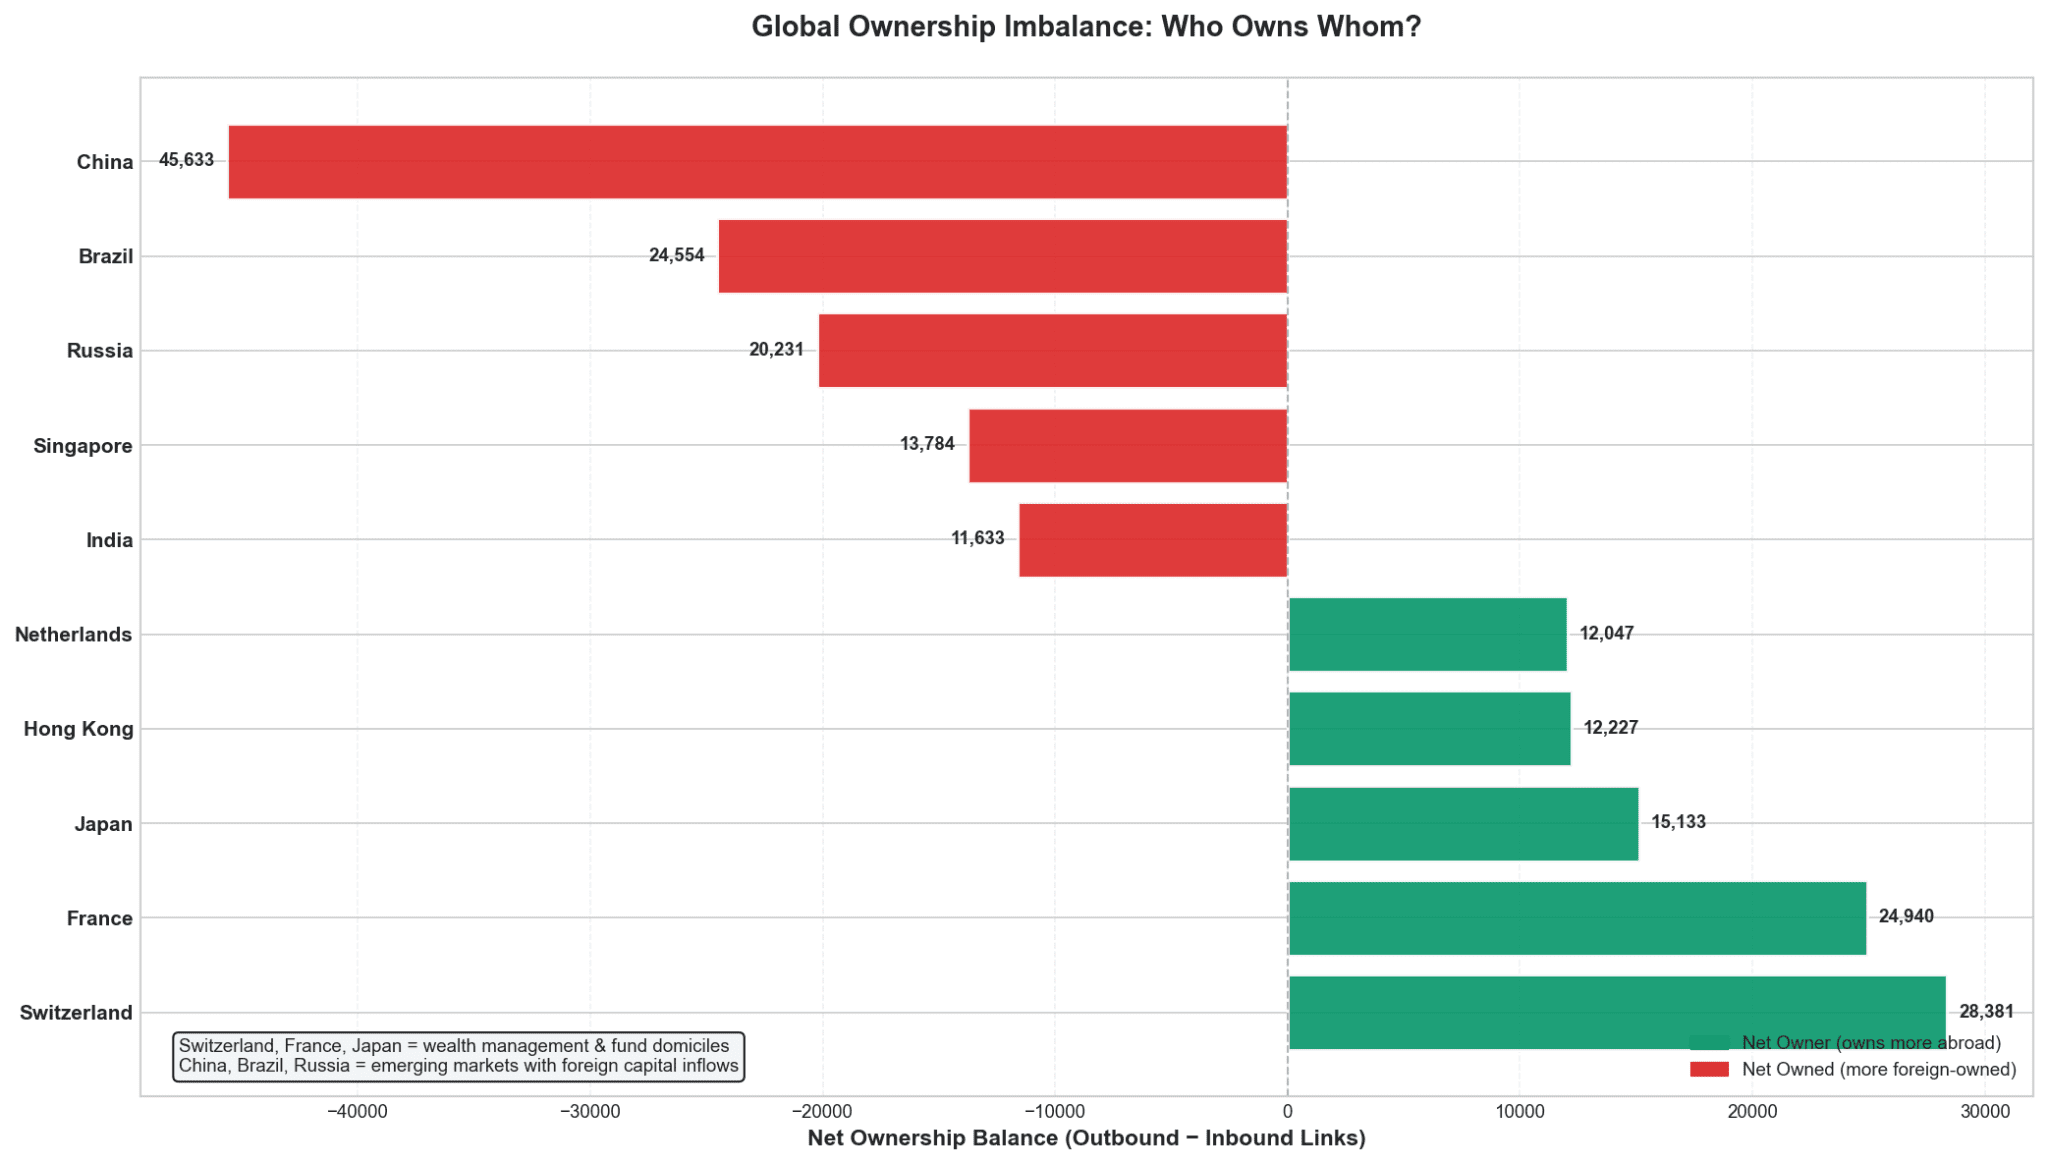
⚖️ Net Ownership Balance: Who Owns Whom?
Global Ownership Imbalance
Positive balance = net owner (owns more abroad than foreign-owned domestically). Negative = net owned.
🔍 Click image to enlarge • Green = Net Owner | Red = Net Owned
Top 5 Net Owners vs. Net Owned
Country
Outbound
Inbound
Net Balance
Status
🇨🇭 Switzerland
45,077
16,696
+28,381
Net Owner
🇫🇷 France
49,296
24,356
+24,940
Net Owner
🇯🇵 Japan
44,792
29,659
+15,133
Net Owner
🇭🇰 Hong Kong
34,557
22,330
+12,227
Net Owner
🇳🇱 Netherlands
40,525
28,478
+12,047
Net Owner
🇨🇦 Canada
37,339
39,477
−2,138
Net Owned
🇦🇺 Australia
16,146
18,526
−2,380
Net Owned
🇩🇪 Germany
56,922
65,646
−8,724
Net Owned
🇮🇳 India
10,943
22,576
−11,633
Net Owned
🇨🇳 China
14,974
60,607
−45,633
Net Owned
💡 Interpretation: Switzerland, France, Japan = wealth management & fund domiciles. China, Brazil, Russia = emerging markets with significant foreign capital inflows.
⚠️ Data Quality & Transparency
🔍 Methodology Notes
Source: Bureau van Dijk Orbis (21M majority-owned relationships)
Enrichment: Apollo.io revenue verification (21% match rate); Adapt.io industry classification (6.5% match rate)
Exclusions: Minority stakes, non-majority links, entities with missing critical fields
🇨🇳 Chinese Entities: Verified or Multi-Country (Included in Main Analysis)
Only Chinese entities with verified revenue data OR operations in 2+ countries are included here. Others are flagged as potential artifacts (see methodology appendix).
Parent
Subsidiaries
Countries
Verification Status
China Petroleum & Chemical Corp (Sinopec)
10,628
4
✅ Verified Operating
China – People’s Rep. (Government)
2,582
11
✅ Government Entity
Shenzhen Tingway Technology Co., Ltd.
1,319
1
⚠️ Single-Country, Verified Domain
GF Securities Co., Ltd.
704
5
✅ Multi-Country Financial
Mitsui & Co., Ltd. (Japan-China ops)
912
17
✅ Multi-Country Trading
Tokio Marine & Nichido Fire Insurance
563
11
✅ Multi-Country Insurance
📌 Note: ~4.5M high-count Chinese entities with 1 country and no revenue verification are flagged as suspicious_cn_aggregator or potential_artifact. Full list available in methodology appendix.
🔗 Access the Full Intelligence
This analysis represents a fraction of the Bureau van Dijk Orbis dataset. For complete ownership tracing, custom enrichment, or enterprise integration:
Map subsidiary networks to identify single points of failure, geographic concentration risk, or contingency planning gaps in critical supplier ecosystems.
Verify corporate structures for beneficial ownership registry compliance, politically exposed person (PEP) screening, and adverse media checks in high-risk jurisdictions.
Keywords: beneficial ownership registry • PEP screening • adverse media checks • FATF compliance • KYC automation
📈 Competitive Intelligence
Identify competitor expansion patterns via subsidiary registrations, assess market share consolidation trends, and benchmark strategic positioning across regions.